

.png)
he candlesticks are used to identify trading patterns that help technical analyst set up their trades. These candlestick patterns are used for predicting the future direction of the price movements.
The candlestick patterns are formed by grouping two or more candlesticks in a certain way. Sometimes powerful signals can also be given by just one candlestick.
Candlesticks are comparable to a market’s X-ray vision. You can observe the underlying dynamics at work, such as shifts in the strength and direction of a market and the ways in which emotions influence trends.
In a daily chart, a candlestick represents the price information for one trading day; in an hourly chart, it represents the price information for one hour, and so on. The candlesticks on a chart will adjust in accordance with changes made to the time frame. Next, let’s examine the parts of candlesticks to learn more about their formation and meaning.
In this blog, we will discuss all 35 powerful candlestick patterns, but before that, let us discuss how to read candlestick charts.
How to Read Candlestick Charts?
Candlestick charts originated in Japan over 100 years before the West had developed bar charts and point-and-figure charts. In the 1700s, a Japanese man known as Homma discovered that as there was a link between price and the supply and demand of rice, the markets were also strongly influenced by the emotions of traders.
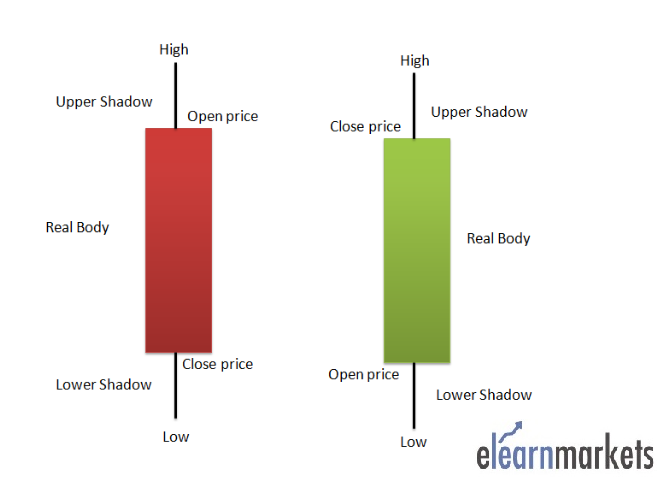
A daily candlestick chart shows the security’s open, high, low, and close prices for the day. The candlestick’s wide or rectangle part is called the “real body” which shows the link between opening and closing prices.
This real body shows the price range between the open and close of that day’s trading.
When the real body is filled, black or red, then it means that the close is lower than the open and is known as the bearish candle. It shows that the prices opened, the bears pushed the prices down and closed lower than the opening price.
If the real body is empty, white or green, then it means that the close was higher than the open, known as the bullish candle. It shows that the prices opened, the bulls pushed the prices up and closed higher than the opening price.
The thin vertical lines above and below the real body are known as the wicks or shadows, which represent the high and low prices of the trading session.
The upper shadow shows the high price, and lower shadow shows the low prices reached during the trading session.
Before we jump into learning about different candlestick charts, there are a few assumptions that need to be kept in mind that are specific to the candlestick charts.
- Strength is represented by a bullish or green candle, and weakness by a bearish or red candle. One should ensure that whenever they are buying, it is a green candle day, and whenever they are selling, ensure that it’s a red candle day.
- The textbook definition of a pattern states certain criteria, but one should state that there could be minor variations to the pattern depending on certain market conditions.
- One should look for a prior trend. If you are looking at a bullish reversal pattern, then the prior trend should be bearish, and if you are looking for a bearish reversal pattern, then the prior trend should be bullish.
35 Types of Candlestick Patterns:
The candlestick patterns can be divided into:
- Continuation Patterns
- Bullish Reversal Patterns
- Bearish Reversal Patterns
Below is the list of 35 Types of Candlestick Patterns which is categorised in the above categories:
Bullish Reversal Candlestick Patterns:
Bullish Reversal candlestick patterns indicate that the ongoing downtrend is going to reverse to an uptrend.
Thus, traders should be cautious about their short positions when the bullish reversal candlestick chart patterns are formed.
Below are the different types of bullish reversal candlestick patterns:
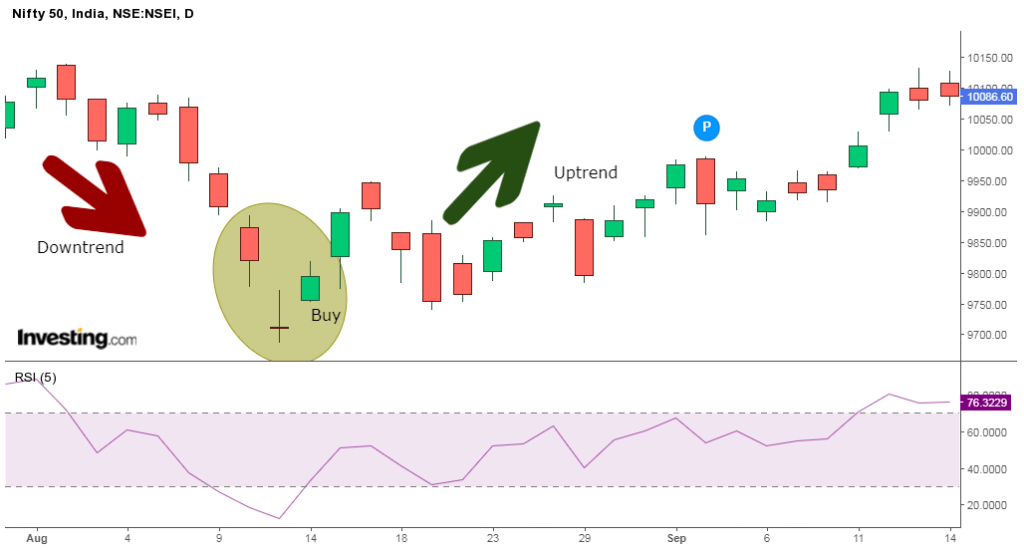
1. Hammer:
Hammer is a single candlestick pattern that is formed at the end of a downtrend and signals a bullish reversal.
The real body of this candle is small and is located at the top with a lower shadow which should be more than twice the real body. This candlestick chart pattern has no or little upper shadow.
The psychology behind this candle formation is that the prices opened, and sellers pushed down the prices.
Suddenly the buyers came into the market and pushed the prices up and closed the trading session more than the opening price.
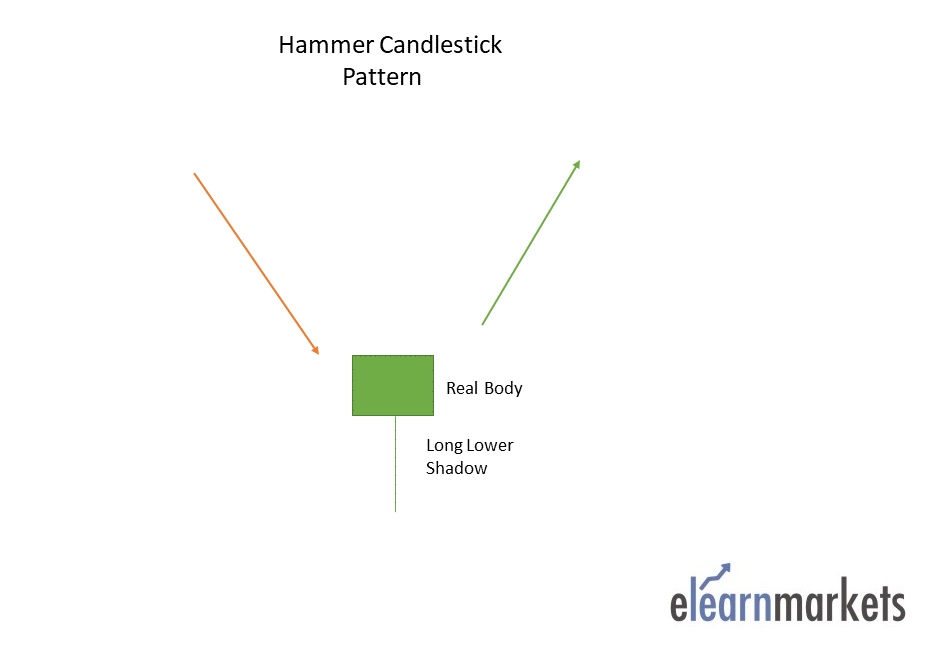
This resulted in the formation of bullish pattern and signifies that buyers are back in the market and downtrend may end.
Traders can enter a long position if next day a bullish candle is formed and can place a stop-loss at the low of Hammer.
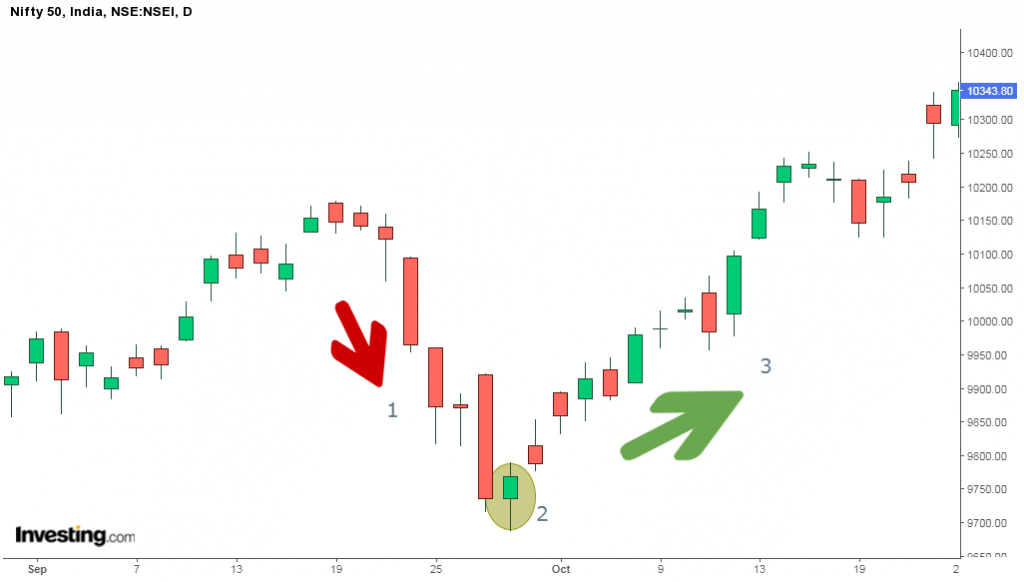
Below is an example of Hammer candlestick pattern:
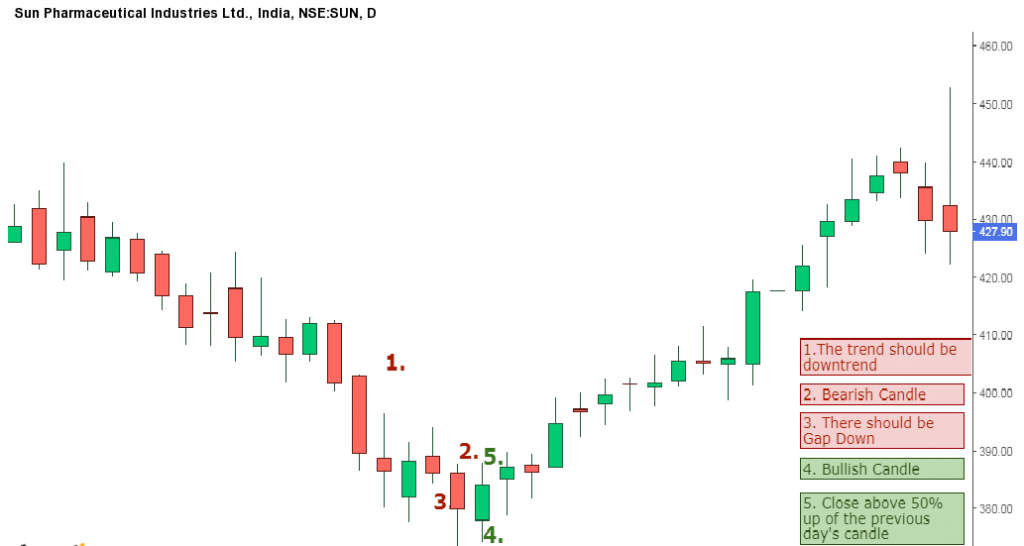
2. Piercing Pattern:
Piercing pattern is a multiple candlestick chart pattern formed after a downtrend indicating a bullish reversal.
Two candles form it, the first candle being a bearish candle which indicates the continuation of the downtrend.
The second candle is a bullish candle which opens the gap down but closes more than 50% of the real body of the previous candle, which shows that the bulls are back in the market and a bullish reversal is going to take place.
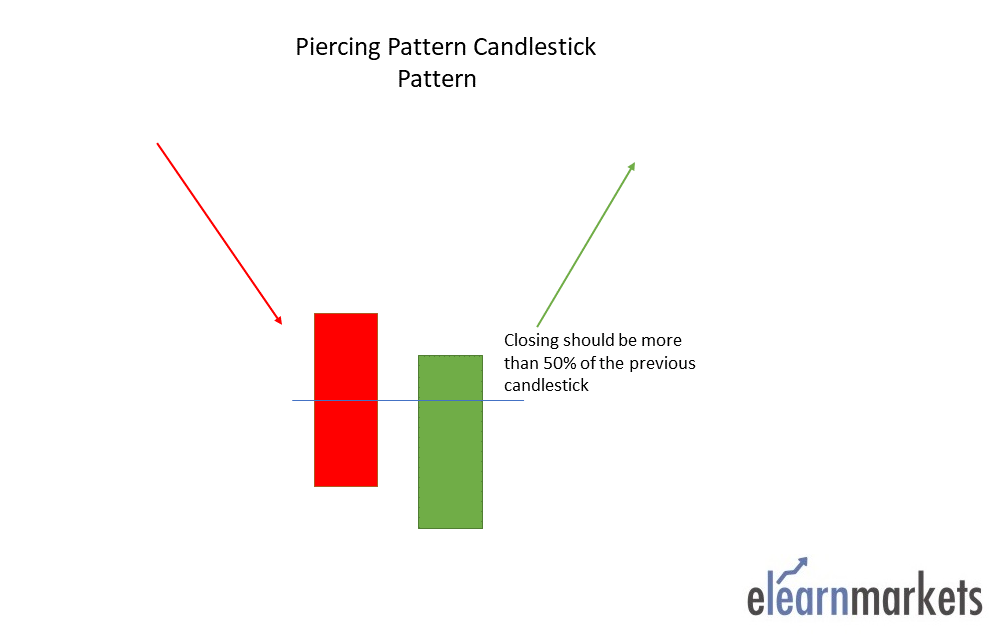
Traders can enter a long position if the next day a bullish candle is formed and can place a stop-loss at the low of the second candle.
Below is an example of a Piercing Candlestick Pattern:
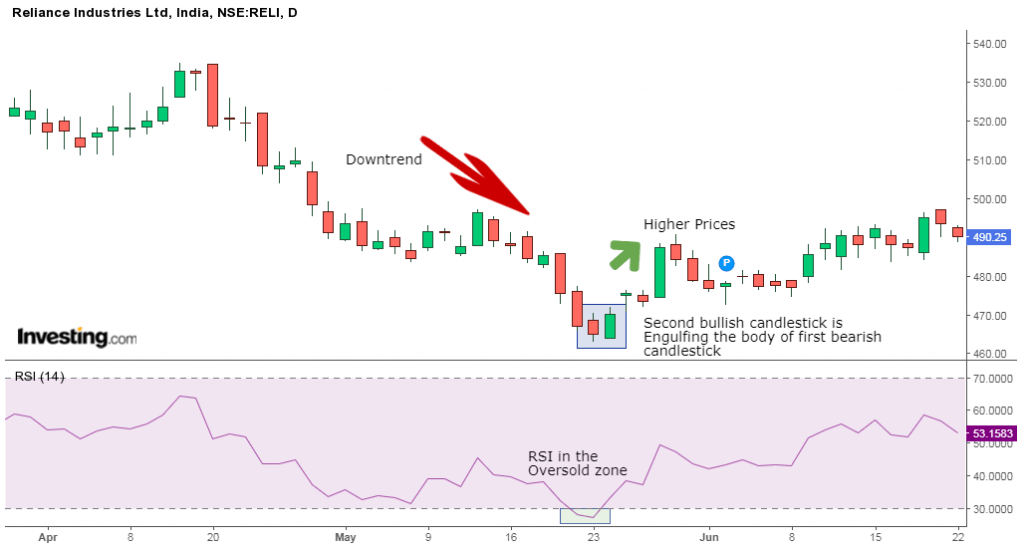
3. Bullish Engulfing:
Bullish Engulfing is a multiple candlestick chart pattern that is formed after a downtrend indicating a bullish reversal.
It is formed by two candles, the second candlestick engulfing the first candlestick. The first candle is a bearish candle that indicates the continuation of the downtrend.
The second candlestick is a long bullish candle that completely engulfs the first candle and shows that the bulls are back in the market.
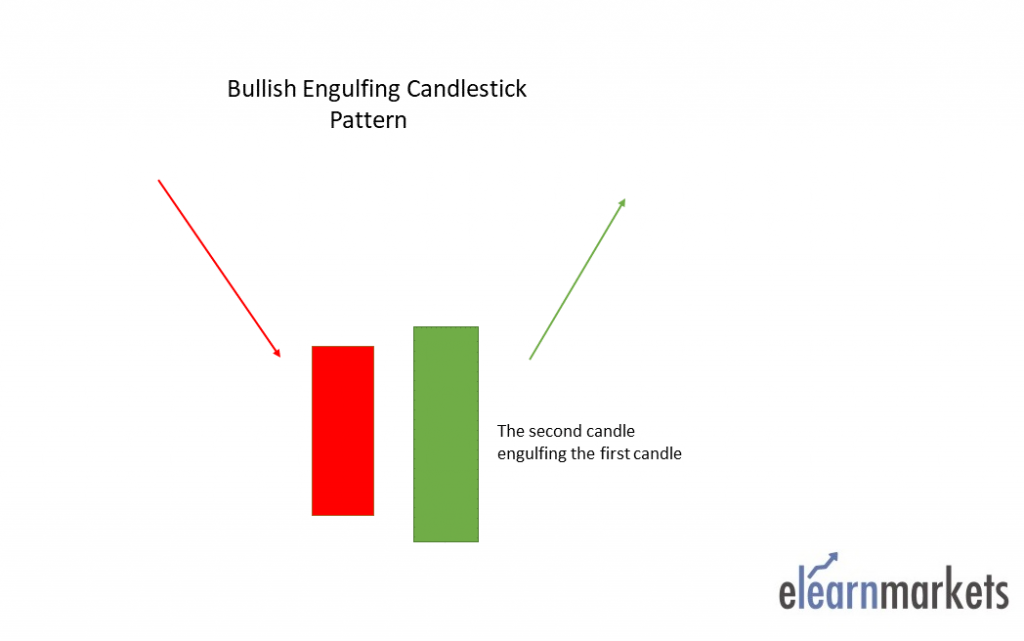
Traders can enter a long position if next day, a bullish candle is formed and can place a stop-loss at the low of the second candle.
Below is an example of a Bullish Engulfing Candlestick Pattern:
4. The Morning Star:
The Morning Star is a multiple candlestick chart pattern that is formed after a downtrend indicating a bullish reversal.
It is made of 3 candlesticks, the first being a bearish candle, the second a Doji and the third being a bullish candle.
The first candle shows the continuation of the downtrend. The second candle being a doji indicates indecision in the market. The third bullish candle shows that the bulls are back in the market and reversal will take place.
The second candle should be completely out of the real bodies of the first and third candles.
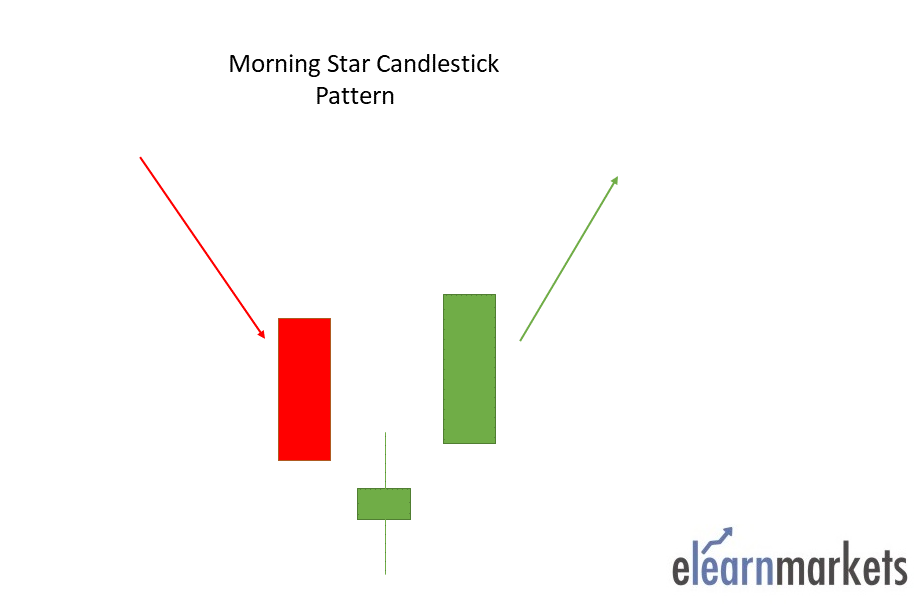
Traders can enter a long position if the next day a bullish candle is formed and can place a stop-loss at the low of the second candle.
Below is an example of Morning Star Candlestick Charts Pattern:
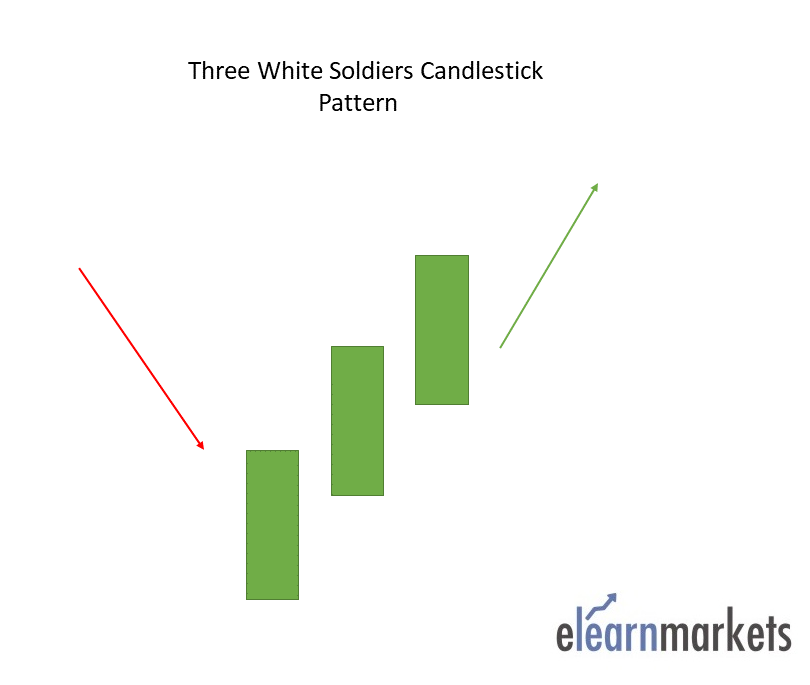
5. Three White Soldiers:
The Three White Soldiers is a multiple candlestick pattern that is formed after a downtrend indicating a bullish reversal.
These candlestick charts are made of three long bullish bodies which do not have long shadows and are open within the real body of the previous candle in the pattern.
6. White Marubozu:
The White Marubozu is a single candlestick pattern that is formed after a downtrend indicating a bullish reversal.
This candlestick has a long bullish body with no upper or lower shadows, which shows that the bulls are exerting buying pressure, and the markets may turn bullish.
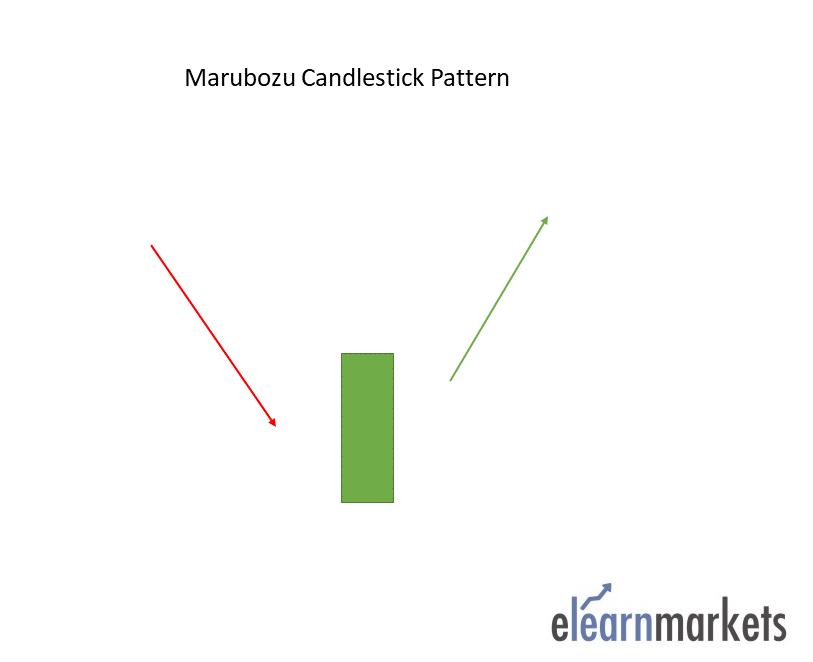
At the formation of this candle, the sellers should be cautious and close their shorting position.
7. Three Inside Up:
The Three Inside Up is a multiple candlestick pattern formed after a downtrend indicating bullish reversal.
It consists of three candlesticks, the first being a long bearish candle, the second candlestick being a small bullish candle which should be in the range the first candlestick.
The third candlestick should be a long bullish candlestick confirming the bullish reversal.
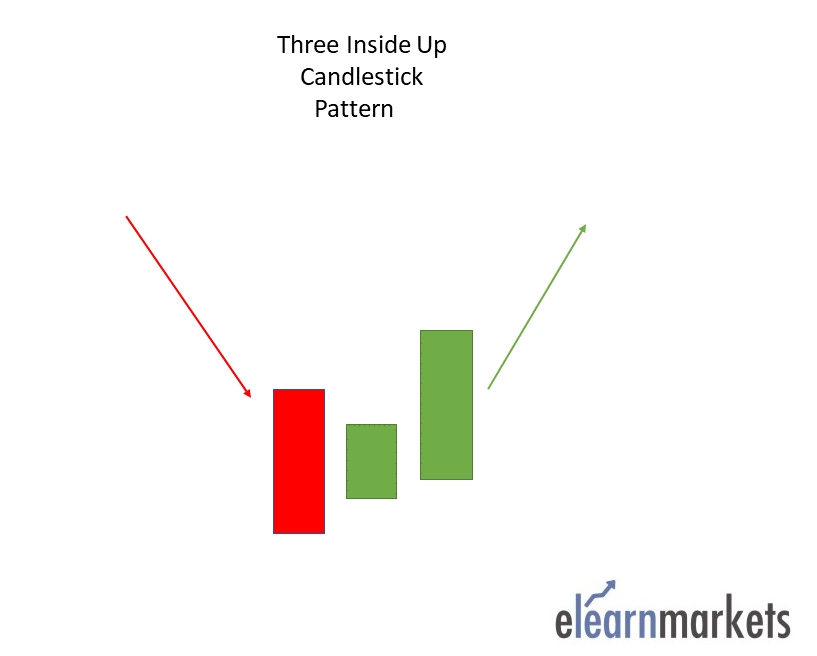
The relationship of the first and second candlestick should be of the bullish harami candlestick pattern.
Traders can take a long position after the completion of this candlestick pattern.
8. Bullish Harami:
The Bullish Harami is multiple candlestick chart pattern which is formed after a downtrend indicating bullish reversal.
It consists of two candlestick charts, the first candlestick being a tall bearish candle and second being a small bullish candle which should be in the range of the first candlestick.
The first bearish candle shows the continuation of the bearish trend and the second candle shows that the bulls are back in the market.
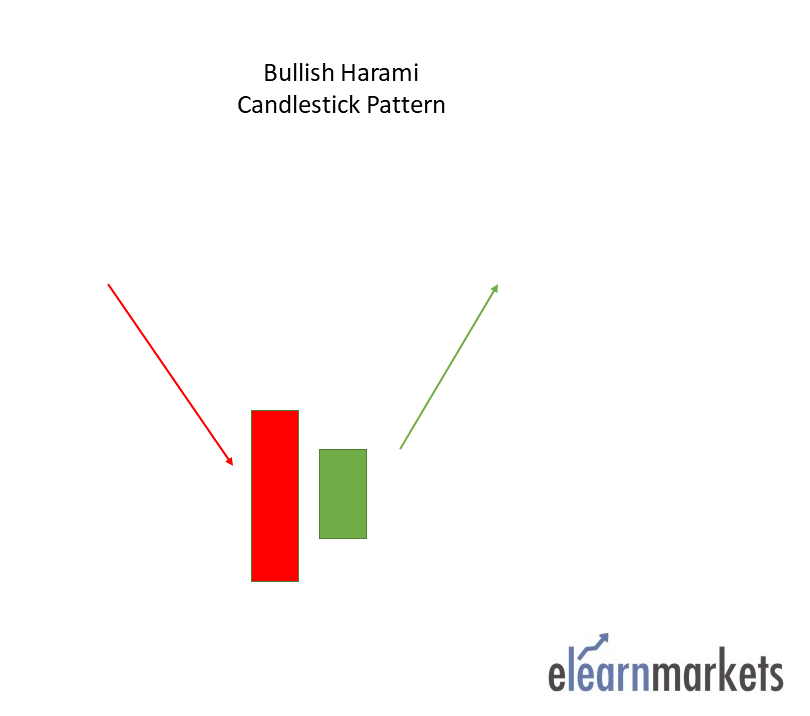
Traders can take a long position after the completion of this candlestick pattern.
9. Tweezer Bottom:
The Tweezer Bottom candlestick pattern is a bullish reversal candlestick pattern that is formed at the end of the downtrend.
It consists of two candlesticks, the first one being bearish and the second one being bullish candlestick.
Both the candlesticks make almost or the same low.When the Tweezer Bottom candlestick pattern is formed the prior trend is a downtrend.
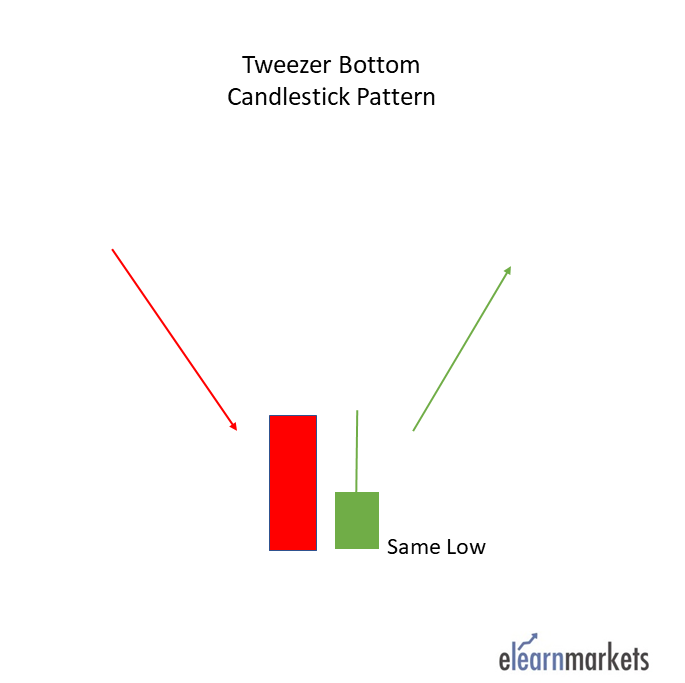
A bearish tweezer candlestick is formed, which looks like the continuation of the ongoing downtrend. On the next day, the second day’s bullish candle’s low indicates a support level.
The bottom-most candles with almost the same low indicate the strength of the support and also signal that the downtrend may get reversed to form an uptrend. Due to this, the bulls step into action and move the price upwards.
This bullish reversal is confirmed the next day when the bullish candle is formed.
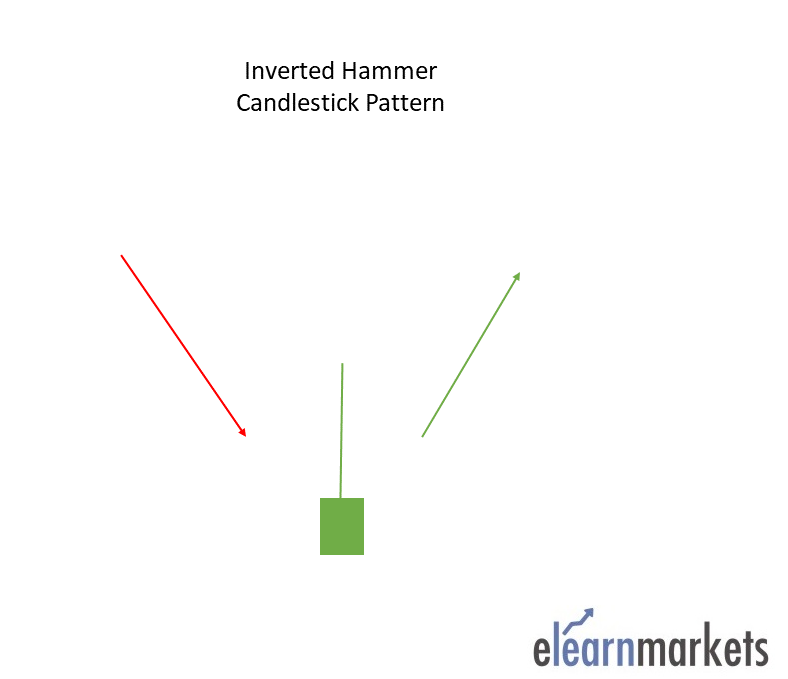
10. Inverted Hammer:
An Inverted Hammer is formed at the end of the downtrend and gives a bullish reversal signal.
In this candlestick, the real body is located at the end, and there is a long upper shadow. It is the inverse of the Hammer Candlestick pattern.
This pattern is formed when the opening and closing prices are near to each other, and the upper shadow should be more than twice the real body.
11. Three Outside Up:
The Three Outside Up is multiple candlestick pattern which is formed after a downtrend indicating bullish reversal.
It consists of three candlesticks, the first being a short bearish candle, the second candlestick being a large bullish candle which should cover the first candlestick.
The third candlestick should be a long bullish candlestick confirming the bullish reversal.
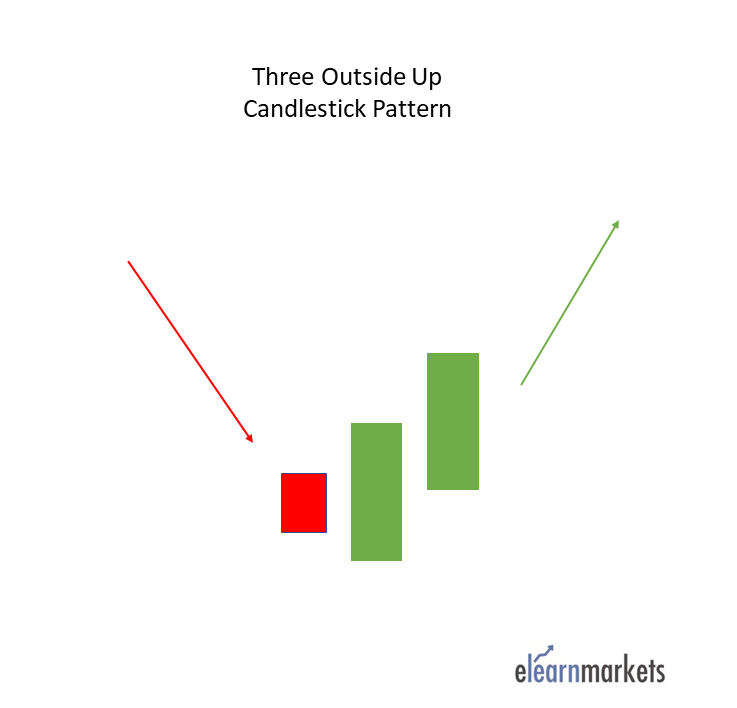
The relationship of the first and second candlestick chart should be of the Bullish Engulfing candlestick pattern.
Traders can take a long position after the completion of this candlestick pattern.
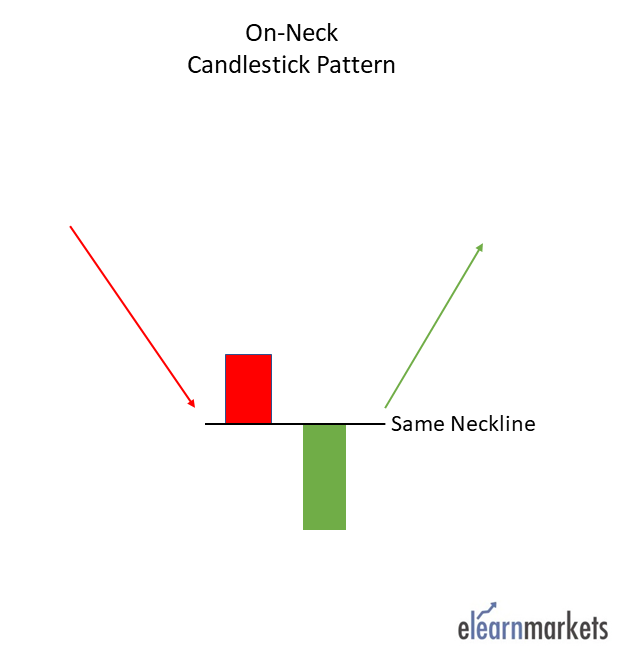
12. On-Neck Pattern:
The on neck pattern occurs after a downtrend when a long real bodied bearish candle is followed by a smaller real bodied bullish candle which gaps down on the open but then closes near the prior candle’s close.
The pattern is called a neckline because the two closing prices are the same or almost the same across the two candles, forming a horizontal neckline.
13. Bullish Counterattack-
The bullish counterattack pattern is a bullish reversal pattern that predicts the upcoming reversal of the current downtrend in the market. This candlestick pattern is a two-bar pattern that appears during a downtrend in the market. A pattern needs to meet the following conditions to be a bullish counterattack pattern.
- There must be a strong downtrend in the market for the formation of the bullish counterattack pattern.
- The first candle must be a long black candle with a real body.
- The second candle must also be a long (ideally, equal in size to the first candle) but a white candle with a real body. The second candle must close near the close of the first candle.
Bearish Candlestick Pattern:
Bearish Reversal candlestick patterns indicate that the ongoing uptrend is going to reverse to a downtrend.
Thus, the traders should be cautious about their long positions when the bearish reversal candlestick patterns are formed.
Below are the different types of bearish reversal candlestick chart patterns:
14. Hanging man:
Hanging Man is a single candlestick pattern that is formed at the end of an uptrend and signals a bearish reversal.
The real body of this candle is small and is located at the top with a lower shadow which should be more than twice the real body. This candlestick pattern has no or little upper shadow.
The psychology behind this candle formation is that the prices opened, and the seller pushed down the prices.
Suddenly the buyers came into the market and pushed the prices up but were unsuccessful in doing so, as the prices closed below the opening price.
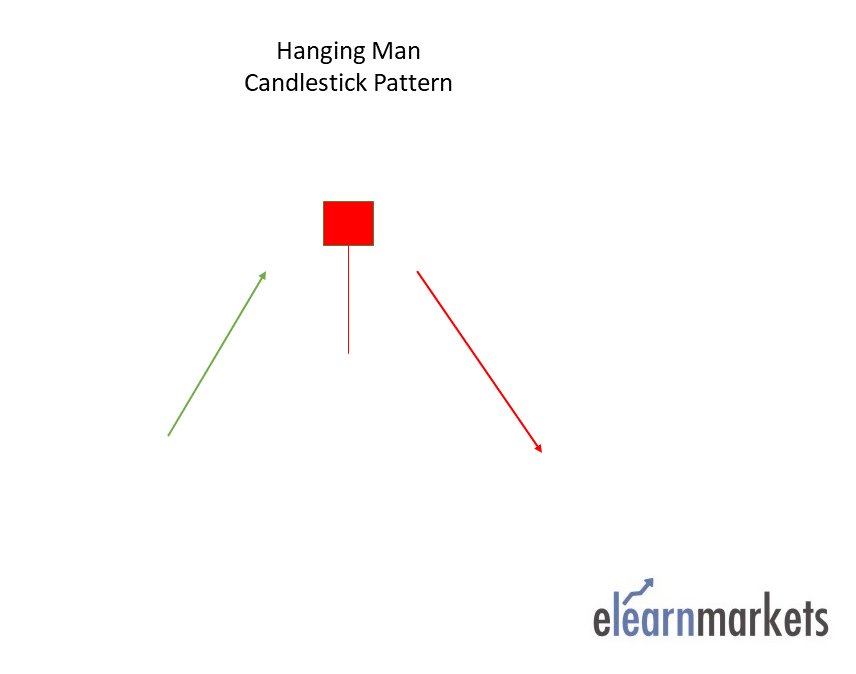
This resulted in the formation of bearish pattern and signifies that seller are back in the market and uptrend may end.
Traders can enter a short position if next day a bearish candle is formed and can place a stop-loss at the high of Hanging Man.
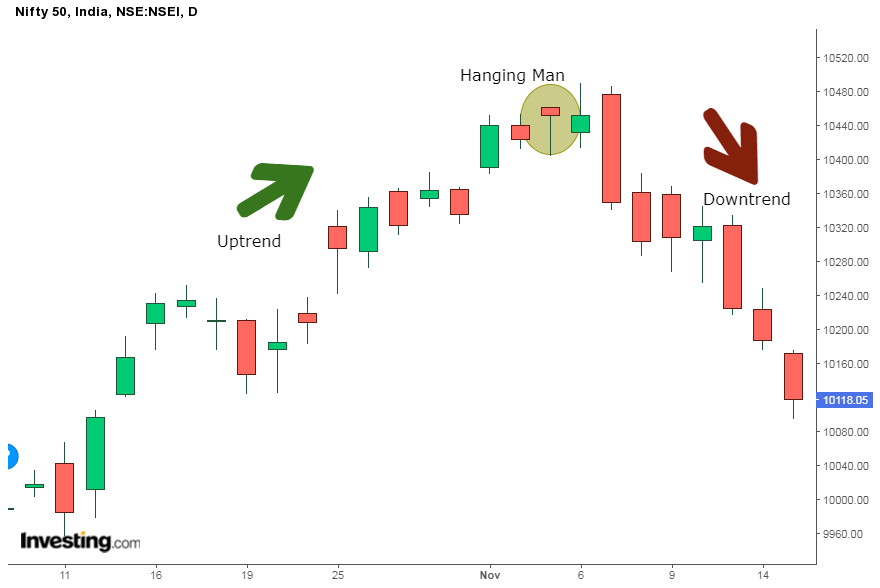
Below is an example of Hanging Man Candlestick Pattern:
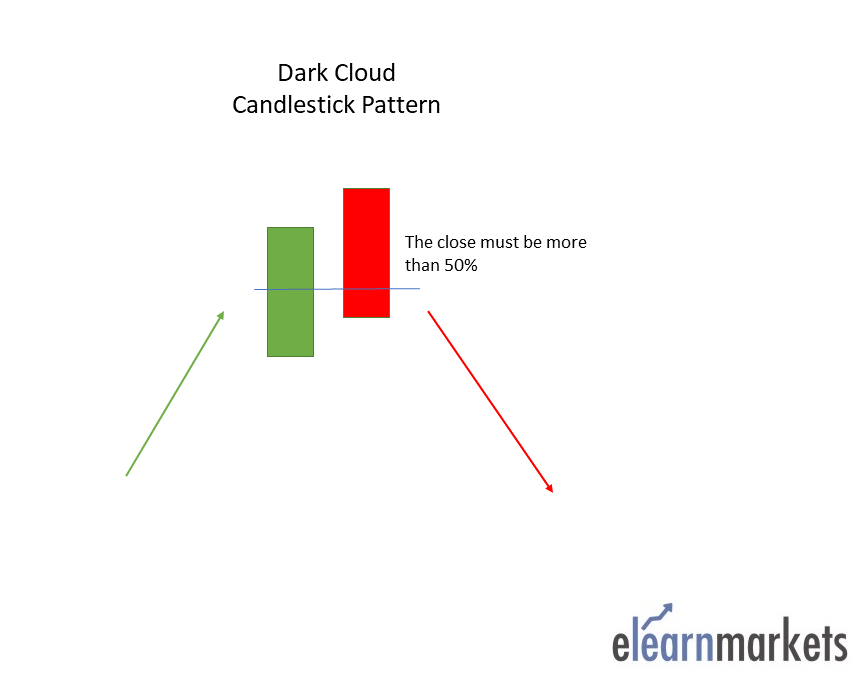
15. Dark cloud cover:
Dark Cloud Cover is a multiple candlestick pattern formed after the uptrend indicating a bearish reversal.
It is formed by two candles, the first candle being a bullish candle which indicates the continuation of the uptrend.
The second candle is a bearish candle which opens the gap up but closes more than 50% of the real body of the previous candle, which shows that the bears are back in the market and a bearish reversal is going to take place.
.png)
.png&description=)
0 Comments